Another one bites the dust? It is said you can lead a horse to water, but you can’t make him drink. In this month’s update I want to share a story of an ex-client who I believe recently fulfilled this expression.
“Don” was a client for many years who happens to work in the technology industry. For the most part he was a great client, but due to several factors we were unable to communicate regularly. As far as I am aware, I do not believe he ever read my book, so I don’t believe he fully comprehended the BLUE LINE INVESTING® investment strategy. The following visual helps illustrate the big picture.
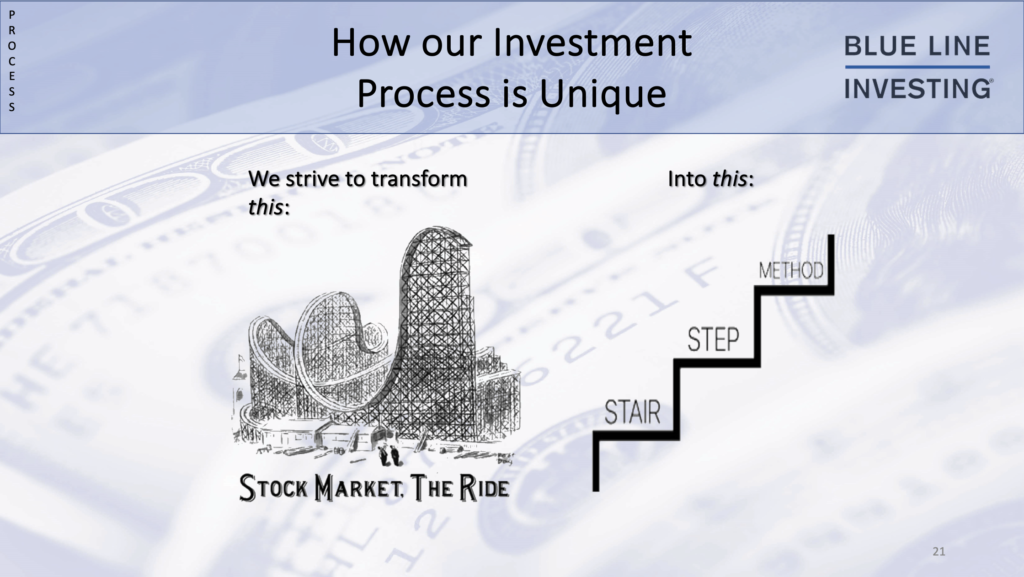
For people like Don, the process of striving to accomplish this at first glance may appear “boring.” After all, two-thirds of our investment strategy is currently invested in passive index ETF’s (Exchange-Traded Funds). So, when stocks like Nvidia and Apple are constantly making new all-time highs, it’s easy for someone like Don to forget that he is indirectly benefitting from their appreciation through his index ETF’s, even though he doesn’t own the stocks directly.
Not long-ago Don reached out to inform me that he decided to self-manage his investment accounts. He had been frustrated with the fact that I was holding on to some cash in his accounts, and felt he was missing out. While he didn’t outright tell me what he was going to invest in, based on previous communications I assume he increased his exposure to technology stocks. As it just so happens, around the same time that Don informed me of his decision, I had posted a short comment on my website blog titled TOP HEAVY? (as well as on LinkedIn) to point out and express my concern over how the top five stocks of the S&P 500 Index (all technology stocks) represented a whopping 25% of the entire index. This, along with the fact that I was unable to find anything in my investment universe that I believed was worth buying that provided a reasonable margin of safety, contributed to why I continued holding excess cash and cash equivalents in client accounts.
The date Don took over self-management of his accounts was June 13, 2024. I have no way of knowing what investment decisions he has taken since then, but for comparison, the technology heavy NASDAQ stock index has since declined approximately 8-9%. While no one has a crystal ball, I am showing the trend channel I have been monitoring since the temporary lows in 2022.
 Chart courtesy of StockCharts.com
What I see is the green-dashed lines identify a rising trend channel that provides investors with a range of possible price movement within that channel. Inside this rising trend is another steeper rising channel, identified by pink-dashed lines. In recent weeks this rising channel proved too steep, and the S&P is now breaking down. It now finds itself back inside the broader green lined rising channel.
As I wrote in my book, Protecting The Pig, I believe this information can help investors in two specific ways. First, it provides a visual for the potential range of price movement investors should expect for the foreseeable future. Second, when used with other indicators, it can help identify price targets for where to consider new or additional purchases for long-term investments.
Based on what is unfolding in financial markets over recent days and may continue to unfold over coming weeks or month(s), had Don remained a client he may have eventually seen the excess cash and cash equivalents finally disappear from his accounts. Should the market decline sufficiently, the cash and cash equivalents may shortly be used to buy long-term investments at prices that I believe may offer a much more reasonable margin of safety.
STOCK MARKET, WATCHING FOR THE SUMMIT:

Chart courtesy of StockCharts.com
The S&P finished the month of July 9.02% above the Blue Line, compared to being 10.30% above the Blue Line at the end of June. Thank you for reading this update, and for the continued trust and support from old as well as new clients.
Jeff Link
Disclaimers:
The BLUE LINE INVESTING® (BLI) investment process was founded on over 95 years of stock market history. It seeks to identify and align investment decisions with multiyear trends. Various aspects of this process have been illustrated in my book Protecting The Pig: How Stock Market Trends Reveal the Way to Grow and Preserve Your Wealth.
The S&P 500 Index is one of the most commonly followed equity indices, and many consider it one of the best representations of the U.S. stock market, and a bellwether for the U.S. economy. It is comprised of 500 large companies having common stock listed on the NYSE or NASDAQ. The volatility (beta) of the account may be greater or less than the index. It is not possible to invest directly in this index.
Technical analysis is a method of evaluating securities by analyzing statistics generated by market activity, such as past prices and volumes. Technical analysis attempts to predict a future stock price or direction based on market trends. The assumption is that the market follows discernible patterns and if these patterns can be identified then a prediction can be made. The risk is that markets may not always follow patterns. There are certain limitations to technical analysis research, such as the calculation results being impacted by changes in security price during periods of market volatility. Technical analysis is one of many indicators that may be used to analyze market data for investing purposes and should not be considered a guaranteed prediction of market activity. The opinions expressed are those of BLI. The opinions referenced are as of the date of publication and are subject to change without notice. BLI reserves the right to modify its current investment strategies based on changing market dynamics or client needs.
Past performance is not indicative of future results. This material is not financial advice or an offer to sell any product. The information contained herein should not be considered a recommendation to purchase or sell any particular security. Forward-looking statements cannot be guaranteed.
Guardian Wealth Advisors, LLC (“GWA”) is an investment adviser registered with the U.S. Securities and Exchange Commission. Registration does not imply a certain level of skill or training. More information about GWA’s investment advisory services can be found in its Form CRS or Form ADV Part 2, which is available upon request.
GWA-24-59
