
In last month’s update I shared words of investment wisdom from Warren Buffett, the Oracle of Omaha. In case you missed it, he said: “The first rule of an investment is don’t lose. And the second rule of an investment is don’t forget the first rule. And that’s all the rules there are.” I also shared words of wisdom from Michael Jordan. In one of his interviews, he said: “So that’s the things my father and my mother instilled in me–take a negative and turn it into a positive.”
These are great words, but how exactly does someone put them into practice? I believe the simple and straightforward answer is summed up by a phrase almost every investor has heard sometime during their investing lifetimes: Buy low, sell high. To help illustrate how I strive to apply this concept I have attached my BLUE LINE INVESTING® Strategy Playbook.
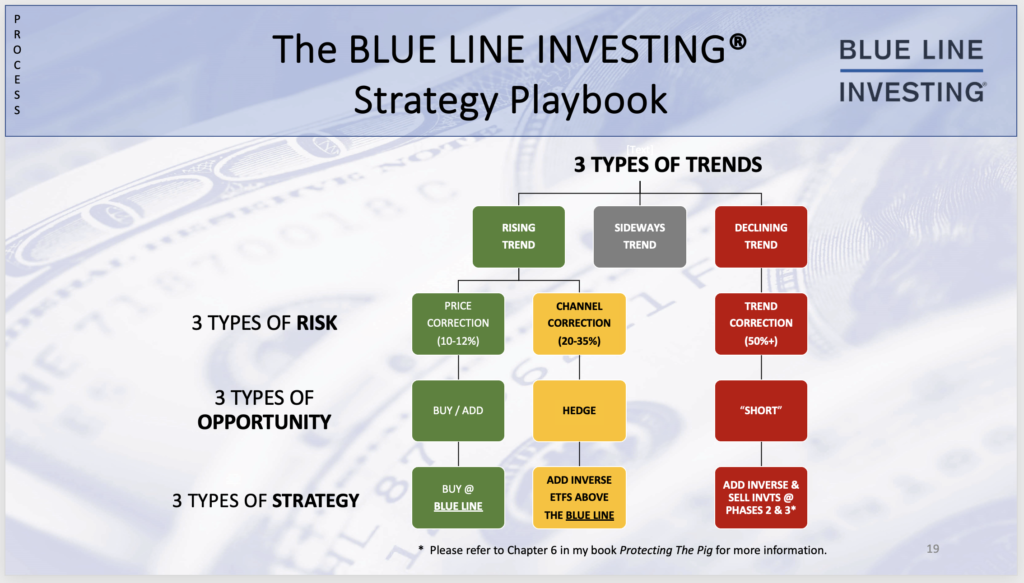
This playbook was designed around striving to prevent or limit the risk of investment loss, or as Michael essentially said, turning a negative into a positive. When it comes to investing in the stock market over the long-term, there are 3 primary risks almost every investor faces. Understanding these 3 risks, and actively looking for them (even though they occur relatively infrequently) can help you see the train coming down the track long before you get hit. When you change your perspective and look at risk as a potential opportunity, this allows you to attempt to manifest that potential opportunity into reality by applying the proper strategy.
As I recall, almost every prospective client I have talked with over the past 25 years is familiar with buy low, sell high, and every one of them believes in it. But surprisingly, not one of them puts it into practice. Not one! Instead, they, along with the Investment Professional (IP) they were working with at that time choose to follow a strategy that will ride the stock market roller coaster all the way to the top…and then remain on the ride all the way to the bottom. And it is not much different today. And what is even more surprising is in some cases, people who had said they believe in a buy low, sell high strategy afterward balk at the idea of putting it into practice, even claiming it is analogous to timing the market. I must remind them that that is the whole purpose of attempting to “sell high.”
I’ll keep my comments brief since it’s summertime and the week of July 4th. But if you or someone you know is 50-65 years old, have financial investments more than $500,000, and worry about suffering future investment losses, please reach out (833) 258-2583. As I wrote in my book, Protecting The Pig, most of the historically significant investment losses follow a pattern, and by recognizing those patterns, I believe you can choose whether it will become a negative or a positive to you.
STOCK MARKET, THE TREND:
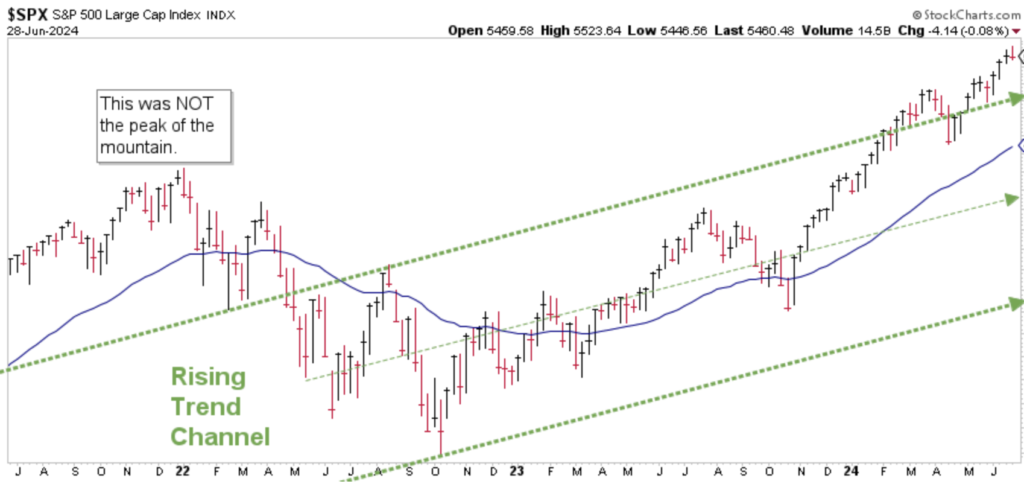
Chart courtesy of StockCharts.com
My views are neither positive or negative on the market at this time, but continue to be neutral. As I referenced in a LinkedIn Post, Did You Know? the top 5 stocks in the S&P currently represents 25% of the entire weight of the index. In other words, the index is very top heavy which I believe increases the risk of future short-term loss.
STOCK MARKET, WATCHING FOR THE SUMMIT:
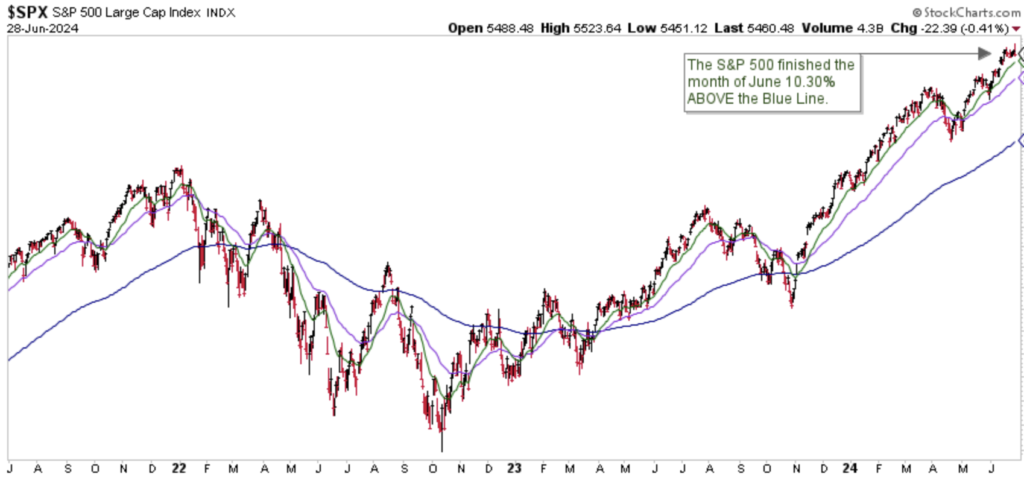
Chart courtesy of StockCharts.com
The S&P finished the month of June 10.30% above the Blue Line, compared to being 8.78% above the Blue Line at the end of May. Thank you for reading this update, and for the continued trust and support from my clients.
Jeff Link
Disclaimers:
The BLUE LINE INVESTING® (BLI) investment process was founded on over 95 years of stock market history. It seeks to identify and align investment decisions with multiyear trends. Various aspects of this process have been illustrated in my book Protecting The Pig: How Stock Market Trends Reveal the Way to Grow and Preserve Your Wealth.
The S&P 500 Index is one of the most commonly followed equity indices, and many consider it one of the best representations of the U.S. stock market, and a bellwether for the U.S. economy. It is comprised of 500 large companies having common stock listed on the NYSE or NASDAQ. The volatility (beta) of the account may be greater or less than the index. It is not possible to invest directly in this index.
Technical analysis is a method of evaluating securities by analyzing statistics generated by market activity, such as past prices and volumes. Technical analysis attempts to predict a future stock price or direction based on market trends. The assumption is that the market follows discernible patterns and if these patterns can be identified then a prediction can be made. The risk is that markets may not always follow patterns. There are certain limitations to technical analysis research, such as the calculation results being impacted by changes in security price during periods of market volatility. Technical analysis is one of many indicators that may be used to analyze market data for investing purposes and should not be considered a guaranteed prediction of market activity. The opinions expressed are those of BLI. The opinions referenced are as of the date of publication and are subject to change without notice. BLI reserves the right to modify its current investment strategies based on changing market dynamics or client needs.
Past performance is not indicative of future results. This material is not financial advice or an offer to sell any product. The information contained herein should not be considered a recommendation to purchase or sell any particular security. Forward-looking statements cannot be guaranteed.
Guardian Wealth Advisors, LLC (“GWA”) is an investment adviser registered with the U.S. Securities and Exchange Commission. Registration does not imply a certain level of skill or training. More information about GWA’s investment advisory services can be found in its Form CRS or Form ADV Part 2, which is available upon request.
GWA-24-50
