
AUGUST 2020
As you have likely read or heard through recent media headlines, the US stock market is breaking out to new all-time highs. The Nasdaq Index (NASDAQ) is at a new record high, the S&P 500 Index (S&P) is at a new record high, and the Dow Jones Industrial Average (DJIA) is not far behind. But how accurate are these headlines? In this brief report I am going to highlight what I believe all investors should be paying attention to right now.
The chart below is of the New York Stock Exchange Composite (NYSE). This chart illustrates over 2,800 publicly traded companies that trade on the NYSE. As you can see, it is currently 9% below its previous high.
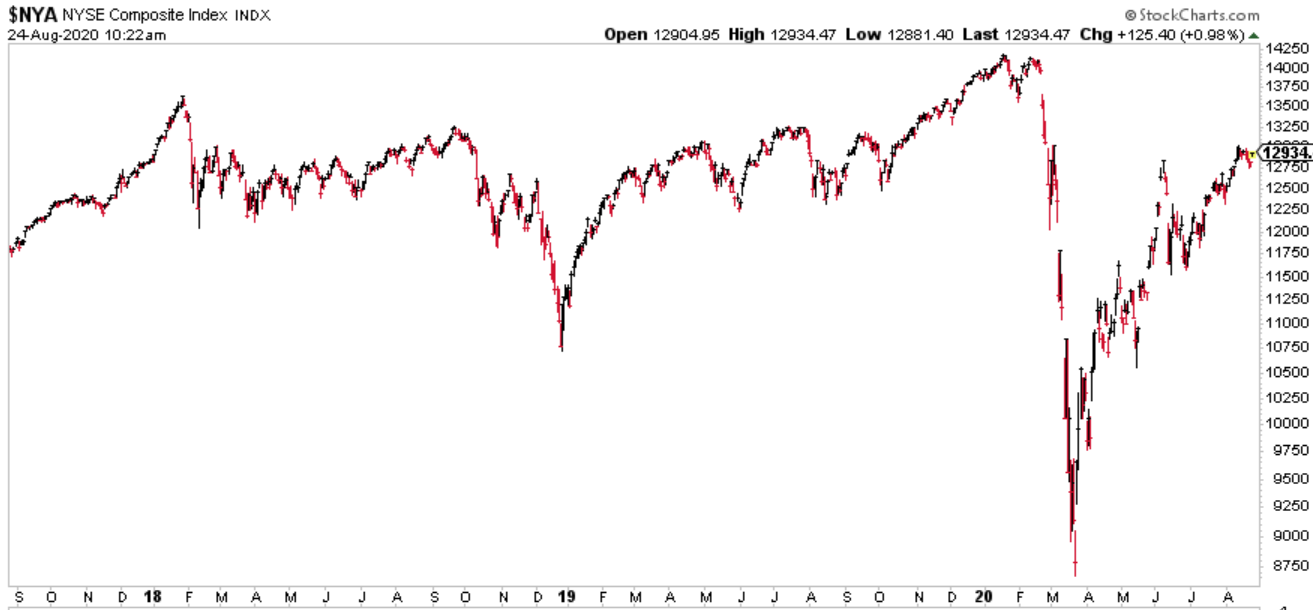
Chart courtesy of StockCharts.com
So, if the NASDAQ and S&P are at all time highs with the DJIA not far behind, how can we reconcile this difference? Can we find a common denominator? Yes, I believe we can.
The screenshots that follow highlight the top five publicly traded stocks for the three indices referenced above. Do you notice the common denominator(s)?
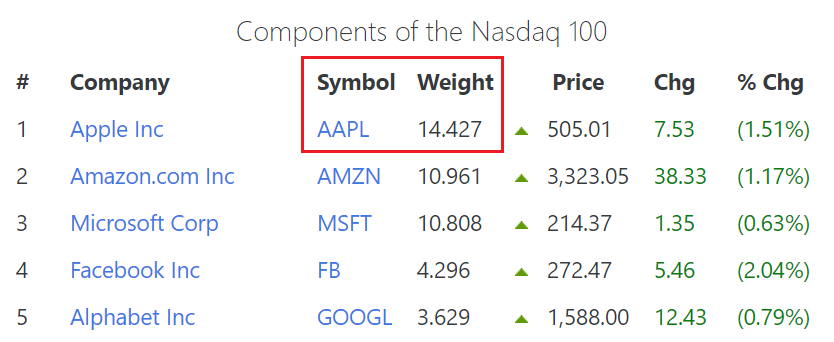
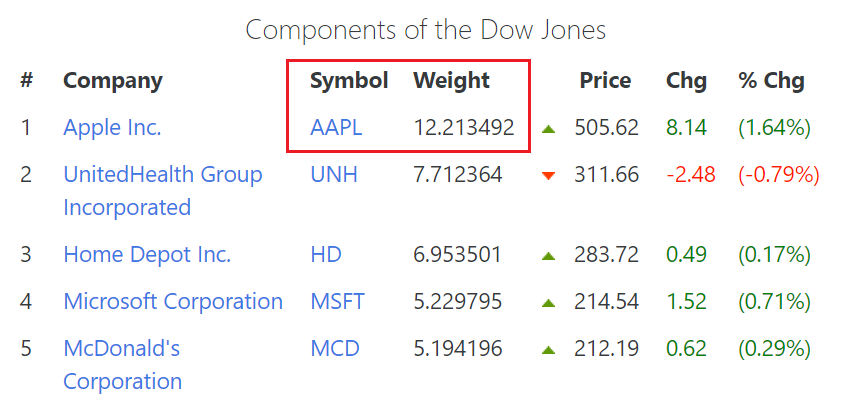
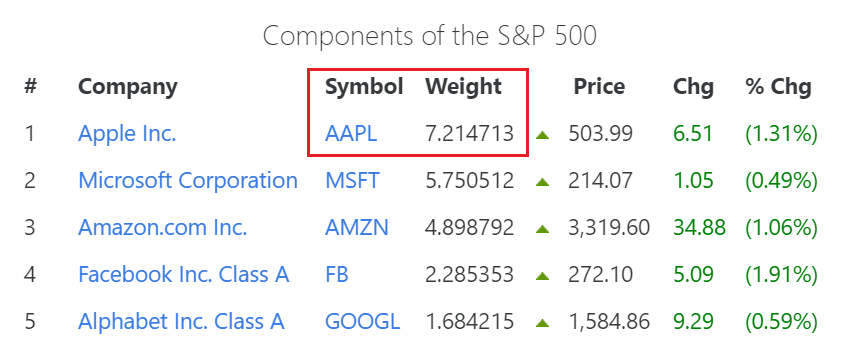
Source: Slickcharts.com
Out of 100 stocks that comprise the Nasdaq 100, Apple, Inc. makes up 14% of the entire index. Out of the 30 stocks that comprise the DJIA, Apple, Inc. makes up 12% of the entire index. And out of the over 500 stocks that comprise the S&P, Apple, Inc. makes up 7% of the entire index. So, should you just buy Apple stock and call it a day? Before you decide, take a look below at the chart I worked on earlier this morning.
APPLE, Inc.
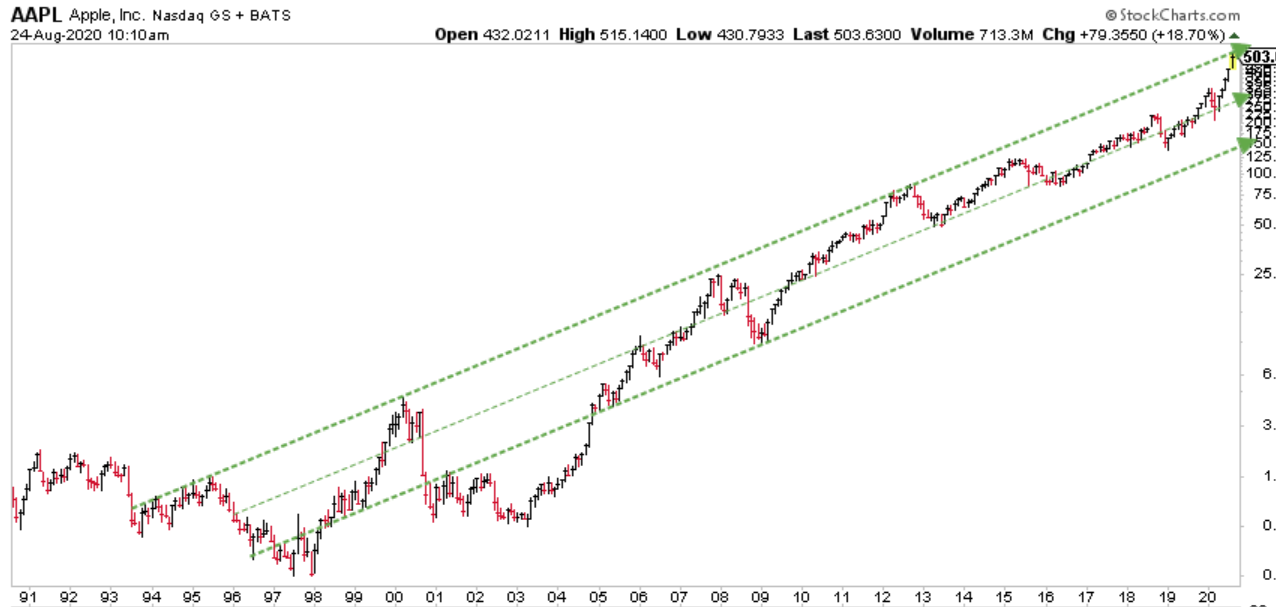
Chart courtesy of StockCharts.com
This is a 30-year chart of Apple, Inc., and while the performance of this stock has been impressive, it is important to note that the current price is just about at the top of a rising trend channel that can be traced back to the mid-1990’s. If this channel is identified correctly, Apple, Inc. may be nearing a price top (at least temporarily). If it does, it is possible the price could decline over the coming weeks or months. And considering how significant a weight this stock is in the NASDAQ, S&P, and DJIA, I do not believe any investor should be surprised if a price correction materializes soon.
Thank you for reading this special report, and please do not hesitate to call (833) 258-2583 with questions or if we may be of service.
Jeff Link
Disclaimers:
BLUE LINE INVESTING® (BLI) is an actively managed investment process that pursues our mission by combining a trend following investment philosophy and a “buy low, sell high” investment strategy. Our mission is to grow our client’s financial wealth over a full market cycle in a risk-managed and tax-efficient way.
The S&P 500 Index is the Standard & Poor’s Composite Index and considered one of the best representations of the U.S. stock market. It is market-cap weighted and is comprised of 500 large companies having common stock listed on the NYSE capturing approximately 80% coverage of available market capitalization. The Nasdaq Index is a stock market index that includes almost all stocks listed on the NYSE. It is a capitalization-weighted index and is heavily weighted towards companies in the information technology sector. The Dow Jones Industrial Average is a stock market index that measures the stock performance of 30 large companies listed on the NYSE. It is not weighted by market capitalization and does not use a weighted arithmetic mean. The volatility (beta) of the account may be greater or less than the index. It is not possible to invest directly in these indices.
Technical analysis is a method of evaluating securities by analyzing statistics generated by market activity, such as past prices and volumes. Technical analysis attempts to predict a future stock price or direction based on market trends. The assumption is that the market follows discernible patterns and if these patterns can be identified then a prediction can be made. The risk is that markets may not always follow patterns. There are certain limitations to technical analysis research, such as the calculation results being impacted by changes in security price during periods of market volatility. Technical analysis is one of many indicators that may be used to analyze market data for investing purposes and should not be considered a guaranteed prediction of market activity. The opinions expressed are those of BLI. The opinions referenced are as of the date of publication and are subject to change without notice. BLI reserves the right to modify its current investment strategies based on changing market dynamics or client needs.
Past performance is not indicative of future results. This material is not financial advice or an offer to sell any product. The information contained herein should not be considered a recommendation to purchase or sell any particular security. Forward looking statements cannot be guaranteed.
Guardian Wealth Advisors, LLC (“GWA”) is an investment adviser registered with the U.S. Securities and Exchange Commission. Registration does not imply a certain level of skill or training. More information about GWA’s investment advisory services can be found in its Form ADV Part 2, which is available upon request.
GWA-20-11

