
What we learn from history is that people don’t learn from history
Warren Buffett
The US stock market, as measured by the S&P 500 Index (S&P), finished the month of March 13.6% below the Blue Line, compared to -4.20% at the end of February.
BLUE LINE PERSPECTIVE
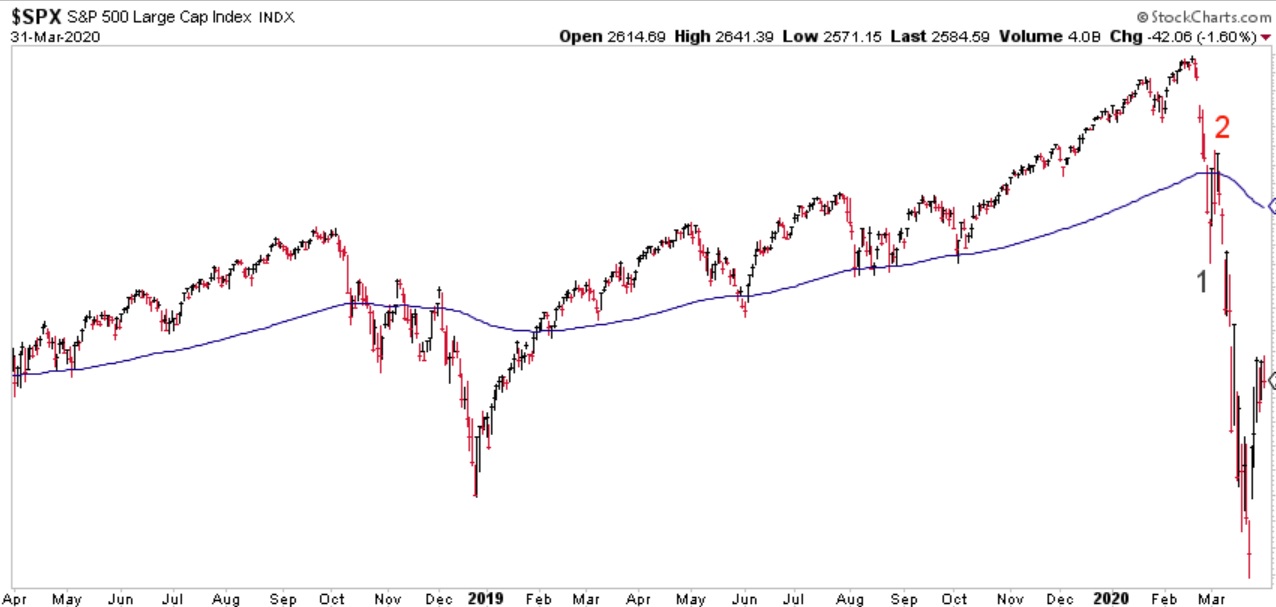
Chart courtesy of StockCharts.com
On February 28th, the S&P triggered the first phase of our sell process—a Phase 1: warning. Six days later, the S&P confirmed the second phase of our sell process—a Phase 2: failure. This price behavior allowed us to make strategic changes to our strategies in accord with our sell process.
As I explained to a client a few weeks ago, we never know the reason why price corrections occur until after the fact. But what we can always monitor is the price behavior of what “smart” investors are doing in anticipation of potential price corrections. This belief is what our three-phase sell process is based upon.
With the sharp price correction beginning from Phase 2 instead of Phase 3, this leads me to believe two things. First, this price correction may be limited to a relatively short period—one measured in months, not years. Second, prices are likely to decline further before the final price low takes place, possibly during the second quarter of 2020.
PRIMARY TREND PERSPECTIVE
The rising primary trend has been modified from last month to include price information dating back to 2009. This view shows price has now broken down through trend channel support and has “bounced” to test it from underneath. (Refer to the red circle.) With trend channel support broken, the door is now open for the possibility of new lows.
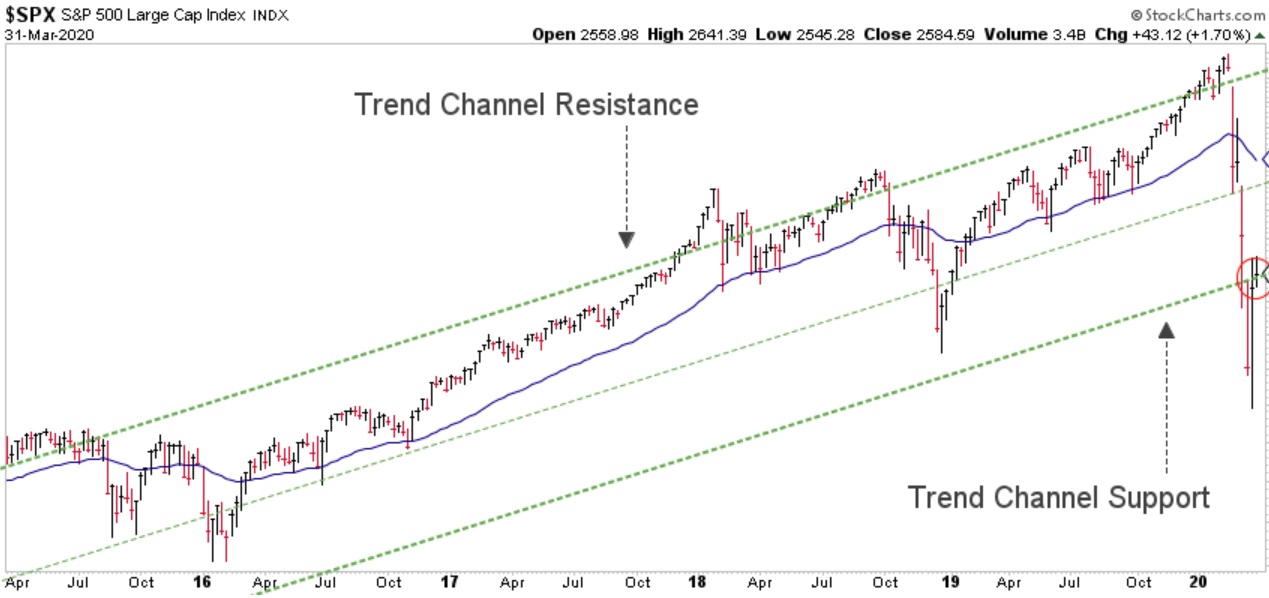
Chart courtesy of StockCharts.com
Remember, it’s difficult for an investor to attempt to “buy low” if they remain fully invested. As a reminder to all clients, the BLUE LINE INVESTING® strategies are not fully invested at this time, and we continue to look for historical patterns that have evidenced a sustainable price bottom may be in place. At this moment, indicators are becoming encouraging, but the evidence is still lacking. Divergences abounded at the price bottom in 1987, 2003, and 2009. If history repeats, I would not be surprised to see new all-time highs in the US stock markets over the coming years.
Thank you for reading the BLUE LINE INVESTING® PRIMARY TREND update, and please do not hesitate to call (833) 258-2583 with questions or if we may be of service.
Jeff Link
Disclaimers:
BLUE LINE INVESTING® (BLI) is an actively managed investment process that pursues our mission by combining a trend following investment philosophy and a “buy low, sell high” investment strategy. Our mission is to grow our client’s financial wealth over a full market cycle in a risk-managed and tax-efficient way.
We monitor the relationship between price and the Blue Line over time to help identify which stock markets worldwide are experiencing rising, sideways, and declining primary trends. We prefer to invest in those markets experiencing rising or sideways primary trends, while avoiding those markets experiencing declining primary trends. The Blue Line helps us identify these trends, and when changes may be taking place.
The S&P 500 Index is one of the most commonly followed equity indices, and many consider it one of the best representations of the U.S. stock market, and a bellwether for the U.S. economy. It is comprised of 500 large companies having common stock listed on the NYSE or NASDAQ. The volatility (beta) of the account may be greater or less than the index. It is not possible to invest directly in this index.
Technical analysis is a method of evaluating securities by analyzing statistics generated by market activity, such as past prices and volumes. Technical analysis attempts to predict a future stock price or direction based on market trends. The assumption is that the market follows discernible patterns and if these patterns can be identified then a prediction can be made. The risk is that markets may not always follow patterns. There are certain limitations to technical analysis research, such as the calculation results being impacted by changes in security price during periods of market volatility. Technical analysis is one of many indicators that may be used to analyze market data for investing purposes and should not be considered a guaranteed prediction of market activity. The opinions expressed are those of BLI. The opinions referenced are as of the date of publication and are subject to change without notice. BLI reserves the right to modify its current investment strategies based on changing market dynamics or client needs.
Past performance is not indicative of future results. This material is not financial advice or an offer to sell any product. The information contained herein should not be considered a recommendation to purchase or sell any particular security. Forward looking statements cannot be guaranteed.
Advisory services offered through Aptus Capital Advisors, LLC, a Registered Investment Adviser registered with the Securities and Exchange Commission. Registration does not imply a certain level or skill or training. More information about the advisor, its investment strategies and objectives, is included in the firm’s Form ADV Part 2, which can be obtained, at no charge, by calling (251) 517-7198. Aptus Capital Advisors, LLC is headquartered in Fairhope, Alabama.
ACA-20-79
