
“The only thing that is constant is change”
– Heraclitus
The US stock market, as measured by the S&P 500 Index (S&P), finished the month of January 6.2% above the Blue Line, compared to 8.40% at the end of December. As such, we view the current primary trend as a rising trend.
BLUE LINE PERSPECTIVE
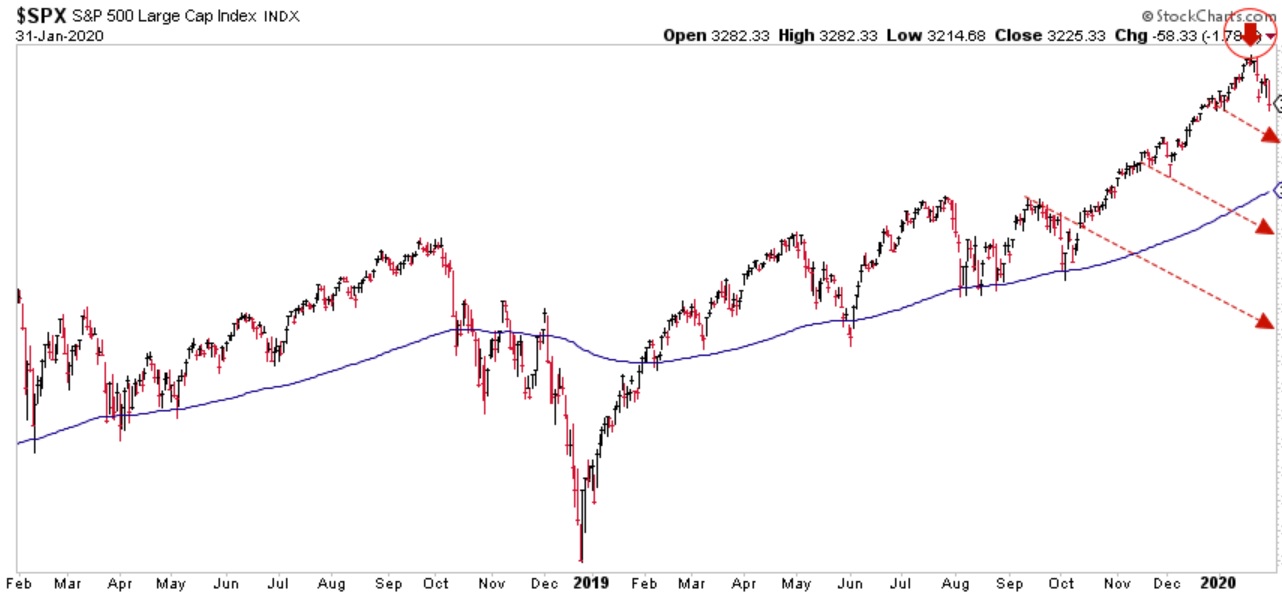
Chart courtesy of StockCharts.com
However, last month I expressed my concern that the 4th quarter 2019 rally appeared very “steep.” Unless the S&P is about to break out and rise much higher, this “steepness” may be warning of a temporary price “top.” IF that proves true, there are only two other directions the stock market can go: sideways or down. In the chart above I have added downward sloping arrows to highlight possible price targets if the stock market continues to decline over the coming weeks or months.
Something else worth taking notice of is the divergence that took place on January 22nd. The S&P and the NASDAQ made new price highs, but the Dow Jones Industrial Average did not. The reason this may be important, at least in the shorter-term, is the last time I recall this happening was at the price bottom in January 2016. During that month, the S&P and the NASDAQ made new price lows, but the Dow Jones Industrial Average did not. Therefore, if a price rally does not materialize relatively soon, the market may retrace some of the price advance from last year.
PRIMARY TREND PERSPECTIVE
To better align this monthly update with both our process and my book scheduled to be published this summer, I will use the following chart going forward to illustrate and monitor the primary trend as we view it.
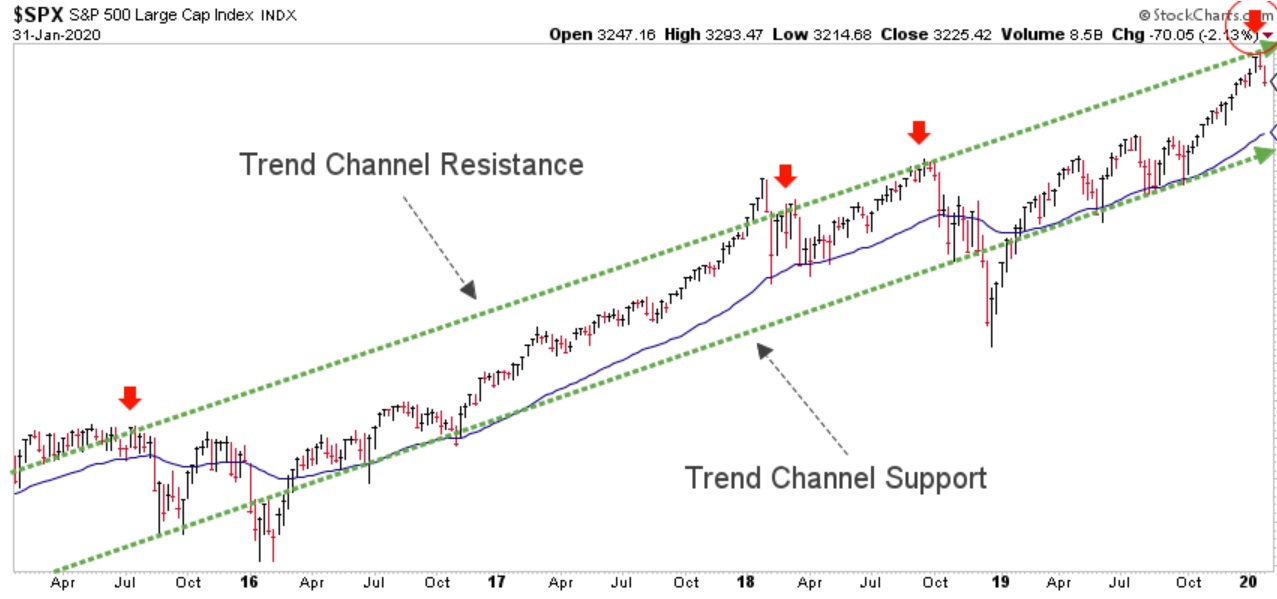
Chart courtesy of StockCharts.com
The two rising dashed green lines represent the primary trend. In the past few years, each time price rose to the top line labeled “Trend Channel Resistance,” shortly thereafter it experienced a price correction. As of today, price is turning down once again from that green line where the red down arrow has been circled. Will it drop all the way back to the bottom of the channel, or even break down through it? Stay tuned to find out over the coming months.
Thank you for reading the BLUE LINE INVESTING® PRIMARY TREND update, and please do not hesitate to call (833) 258-2583 with questions or if we may be of service.
Jeff Link
Disclaimers:
BLUE LINE INVESTING® (BLI) is an actively managed investment process that pursues our mission by combining a trend following investment philosophy and a “buy low, sell high” investment strategy. Our mission is to grow our client’s financial wealth over a full market cycle in a risk-managed and tax-efficient way.
We monitor the relationship between price and the Blue Line over time to help identify which stock markets worldwide are experiencing rising, sideways, and declining primary trends. We prefer to invest in those markets experiencing rising or sideways primary trends, while avoiding those markets experiencing declining primary trends. The Blue Line helps us identify these trends, and when changes may be taking place.
The S&P 500 Index is one of the most commonly followed equity indices, and many consider it one of the best representations of the U.S. stock market, and a bellwether for the U.S. economy. It is comprised of 500 large companies having common stock listed on the NYSE or NASDAQ. The volatility (beta) of the account may be greater or less than the index. It is not possible to invest directly in this index.
Technical analysis is a method of evaluating securities by analyzing statistics generated by market activity, such as past prices and volumes. Technical analysis attempts to predict a future stock price or direction based on market trends. The assumption is that the market follows discernible patterns and if these patterns can be identified then a prediction can be made. The risk is that markets may not always follow patterns. There are certain limitations to technical analysis research, such as the calculation results being impacted by changes in security price during periods of market volatility. Technical analysis is one of many indicators that may be used to analyze market data for investing purposes and should not be considered a guaranteed prediction of market activity. The opinions expressed are those of BLI. The opinions referenced are as of the date of publication and are subject to change without notice. BLI reserves the right to modify its current investment strategies based on changing market dynamics or client needs.
Past performance is not indicative of future results. This material is not financial advice or an offer to sell any product. The information contained herein should not be considered a recommendation to purchase or sell any particular security. Forward looking statements cannot be guaranteed.
Advisory services offered through Aptus Capital Advisors, LLC, a Registered Investment Adviser registered with the Securities and Exchange Commission. Registration does not imply a certain level or skill or training. More information about the advisor, its investment strategies and objectives, is included in the firm’s Form ADV Part 2, which can be obtained, at no charge, by calling (251) 517-7198. Aptus Capital Advisors, LLC is headquartered in Fairhope, Alabama.
ACA-20-22
