
Summer is just around the corner and the one thing that goes with summer is vacations. Even though most people’s destinations will differ, they will all share one thing in common – preparing and packing. Now, how much they prepare and what they pack will partly be determined by how long their vacation will last.
For instance, someone taking a weekend vacation may not need to prepare or pack much in advance because the length of their vacation will be relatively short. On the other hand, someone taking a weeklong vacation may need to prepare and pack more to accommodate for a longer stay. And someone vacationing for a month or more will likely prepare and pack a lot compared to the others.
So, the reason I bring this up is I want to present you with an investment related question. Can we attempt to identify a potentially negative stock market event from the perspective of preparation behavior for a vacation? I believe we can.
In Chapter 5 of my book, Protecting the Pig, I illustrate three types of investment risk that I believe all investors face over time when investing in the stock market, the first being a Price correction, the second a Channel correction, and the third a Trend correction. I believe the most effective way to differentiate between these three types of investment risk is to monitor all investor behavior that precedes a negative stock market event.
For instance, I believe if investors do not expect any significant investment loss in the short-term, then their investment behavior may reflect that. Investors tend to ignore whatever the headline news is for the day and buy stocks at somewhat lower prices “on the dip.” This would be like a person taking a weekend vacation.
However, if investors expect more significant or profound investment loss (like what happened in March 2020), then I believe their investment behavior may reflect that. They may buy investments, like Inverse ETF’s or something similar, that could help protect some of their wealth if stock markets suffer loss. And what I find interesting from my personal research is this behavior can sometimes be noticeable up to several weeks preceding a negative stock market event. This behavior would be like a person preparing for a weeklong vacation.
Finally, if investors expect significant and prolonged investment loss (i.e., years), then I believe their investment behavior once again may reflect that. Instead of buying Inverse ETF’s, or something similar, they may choose instead to sell some or all their stocks in favor of holding cash to protect their wealth. I believe it is helpful to keep in mind that if an endowment or other large investment group wants to sell some of their stock investments, it will take time to do so. This would be like a person preparing to take an extended vacation.
As I have sought to illustrate in recent months, I believe this type of behavior can sometimes be traced for several months or longer before the stock market losses begin. Like preparing for a vacation, I believe our ability to monitor investor behavior can help identify which type of stock market correction (Price, Channel, or Trend) may be looming next on the horizon.
Over the past two months I have focused the attention of these updates on a historical investment pattern that has tended to precede Trend corrections. I illustrated it first in February with GE and March with Boeing. Over the next couple months, I intend to illustrate it with the S&P 500 Index and the Tokyo Nikkei Stock Index. The reason for doing so is to show how I believe one of the best ways to attempt to protect your “pig” (i.e., your financial wealth) is to pay attention to investor behavior instead of media headlines. After all, it does not matter how much is made when stock markets are rising if the unrealized gains are lost when stock markets are declining.
As an aside, out of over 500 stocks that make up the “S&P”, the top five weighted stocks (i.e., 1%) make up 20% of the index which makes it top heavy. I regularly monitor these stocks according to my process to look for any evidence of a potential change in their trends. I believe as they trend, so may the rest of the market.
BLUE LINE Perspective (A Trend Indicator)
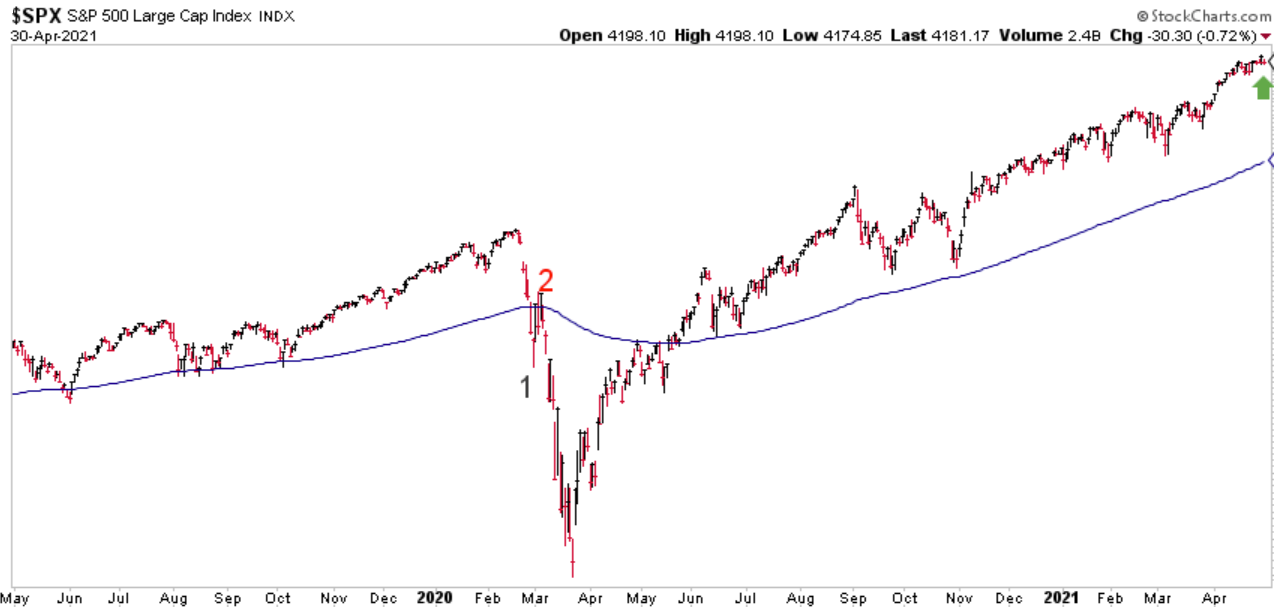
Chart courtesy of StockCharts.com
According to the BLUE LINE INVESTING® process, the current primary trend is defined as a rising trend. The US stock market, as measured by the S&P 500 Index (S&P), finished the month of April 13.1% above the Blue Line, compared to 10.7% above the Blue Line at the end of March (please refer to the green arrow at the far right-hand side of the chart above).
At this time, I believe the most likely type of correction investors face based on the position of price and the Blue Line (as well as other indicators) is a price correction. Once again, this is not a prediction, I am simply pointing out what appears most likely at some point in the future.
As a quick reminder, the purpose for providing this monthly update is to illustrate the BLUE LINE INVESTING® process by applying it to the S&P 500 Index. However, this process is applied to all investments held within our strategies. Thank you for reading and if you know someone who needs help investing their wealth but is worried about of suffering significant investment loss, please invite them to sign up for a complimentary 30-minute phone call by going to https://BlueLineInvesting.YouCanBook.Me/.
Jeff Link
Disclaimers:
BLUE LINE INVESTING® (BLI) is an actively managed investment process that pursues our mission by combining a trend following investment philosophy and a “buy low, sell high” investment strategy. Our mission is to grow our client’s financial wealth over a full market cycle in a risk-managed and tax-efficient way.
We monitor the relationship between price and the Blue Line over time to help identify which stock markets worldwide are experiencing rising, sideways, and declining primary trends. We prefer to invest in those markets experiencing rising or sideways primary trends, while avoiding those markets experiencing declining primary trends. The Blue Line helps us identify these trends, and when changes may be taking place.
The S&P 500 Index is one of the most commonly followed equity indices, and many consider it one of the best representations of the U.S. stock market, and a bellwether for the U.S. economy. It is comprised of 500 large companies having common stock listed on the NYSE or NASDAQ. The volatility (beta) of the account may be greater or less than the index. It is not possible to invest directly in this index.
Technical analysis is a method of evaluating securities by analyzing statistics generated by market activity, such as past prices and volumes. Technical analysis attempts to predict a future stock price or direction based on market trends. The assumption is that the market follows discernible patterns and if these patterns can be identified then a prediction can be made. The risk is that markets may not always follow patterns. There are certain limitations to technical analysis research, such as the calculation results being impacted by changes in security price during periods of market volatility. Technical analysis is one of many indicators that may be used to analyze market data for investing purposes and should not be considered a guaranteed prediction of market activity. The opinions expressed are those of BLI. The opinions referenced are as of the date of publication and are subject to change without notice. BLI reserves the right to modify its current investment strategies based on changing market dynamics or client needs.
Past performance is not indicative of future results. This material is not financial advice or an offer to sell any product. The information contained herein should not be considered a recommendation to purchase or sell any particular security. Forward looking statements cannot be guaranteed.
Guardian Wealth Advisors, LLC (“GWA”) is an investment adviser registered with the U.S. Securities and Exchange Commission. Registration does not imply a certain level of skill or training. More information about GWA’s investment advisory services can be found in its Form ADV Part 2, which is available upon request.
GWA-21-26
